
Course Success Rates
Period Covered: 2024-25
This section displays courses success rates (A, B, C, P grades), non-success rates (D, F, NP, I) and withdraw rates (W, EW) for the most recent academic year, 2024-25. Click or scroll down for
- Course Success by Instructional Modality
- Figure 13: Course Success by Instructional Modality, 2024-25
- Course Success by Race/Ethnicity
- Figure 14: Course Success by Race/Ethnicity, 2024-25
- Course Success by Modality and Race/Ethnicity
- Figure 15: Face-to-Face Course Success by Race/Ethnicity, 2024-25
- Figure 16: Online Course Success by Race/Ethnicity, 2024-25
- Course Success by Gender
- Figure 17: Course Success by Gender, 2024-25
- Success for Courses With Highest Enrollment
- Figure 18: Success Rates for Courses With Highest Enrollment

Course Success by Instructional Modality
De Anza’s overall course success rate was 80% in 2024-25, with a 12% non-success rate and 8% withdraw rate. The success rate for courses taught face-to-face was 84%, followed by the rate for hybrid classes at 81% and the rate for online classes at 79%. This represents a difference of 5 percentage points between face-to-face and online course sections.
Figure 13: Course Success by Instructional Modality, 2024-25
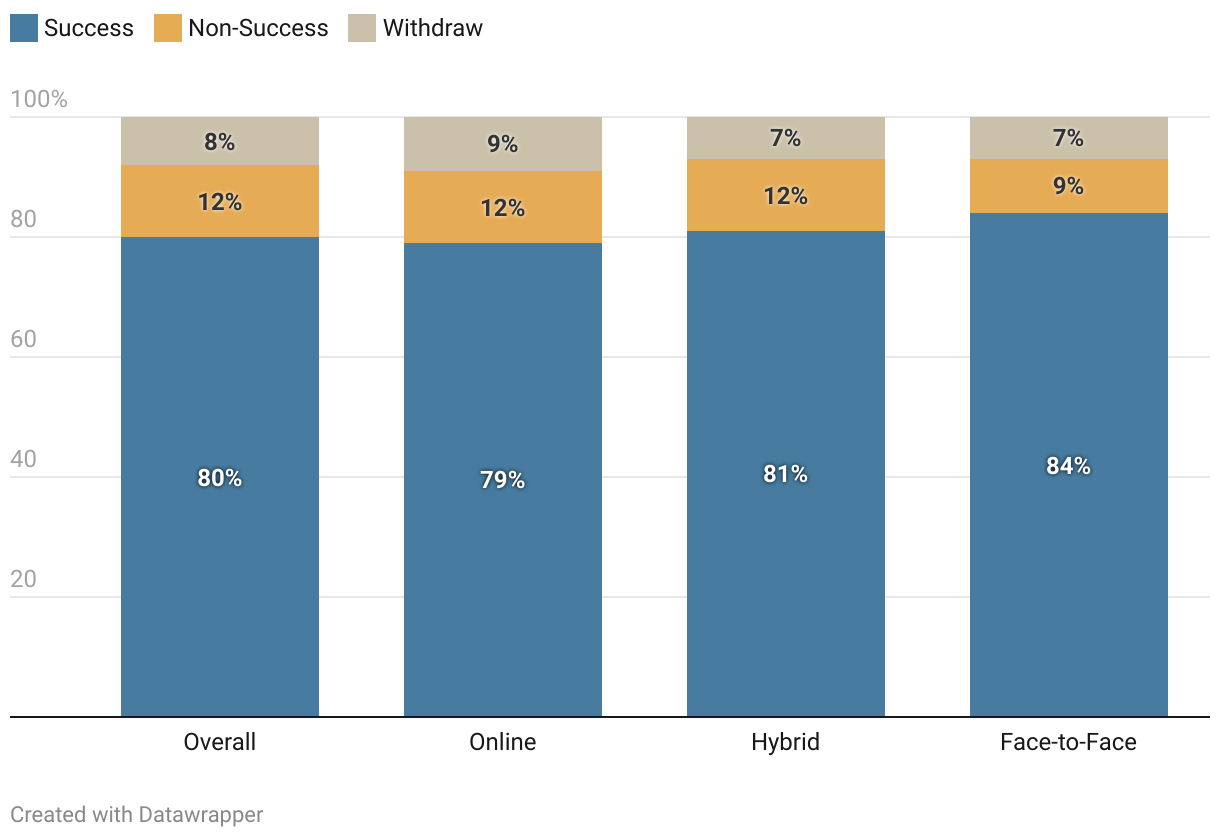
Note: Success includes grades C or higher. Non-success includes D, F and I. Withdraw includes W and EW. Source: De Anza College Office of Institutional Research, Planning and Accreditation
Course Success by Race/Ethnicity
Course success rates are highest for students who identify as Asian (87%). Rates are lowest for students who identify as white (70%), followed by students who identify as Black (72%). Withdraw rates are also highest for white, Black and Latinx students.
Figure 14: Course Success by Race/Ethnicity, 2024-25
Not graphed: students of unknown ethnicity. Source: De Anza College Office of Institutional Research, Planning and Accreditation
Course Success by Modality and Race/Ethnicity
When disaggregated by race or ethnicity, face-to-face success rates were above 80% for all population groups, except for Latinx students (79%). Online course success rates were far lower for certain groups: 63% for white students, 70% for Black students, and 75% for Pacific Islander and Latinx students.
Figure 15: Face-to-Face Course Success by Race/Ethnicity, 2024-25
Note: Includes enrollment in any face-to-face section. Not graphed: students of unknown ethnicity. Source: De Anza College Office of Institutional Research, Planning and Accreditation
Figure 16: Online Course Success by Race/Ethnicity, 2024-25
Note: Includes enrollment in any online section. Not graphed: students of unknown ethnicity. Source: De Anza College Office of Institutional Research, Planning and Accreditation
Course Success by Gender
Female students have a slightly higher course success rate of 82%, compared with 79% for male students. Male students have the highest non-success rates, at 13%.
Figure 17: Course Success by Gender, 2024-25
Source: De Anza College Office of Institutional Research, Planning and Accreditation
Success for Courses With Highest Enrollment
Among the courses with highest enrollment in 2024-25, success rates were lowest for MATH 1A (Calculus I) at 70%, followed by EWRT 1A (English Composition and Reading – renumbered as ENGL C1000 in fall 2025) at 74% and HUMI 1 (Creative Minds) at 77%. Each of those courses had a non-success rate of 16%.
Success rates were highest for ECON 2 (Microeconomics) at 87%, followed by ECON 1 (Macroeconomics) at 85% and MATH 1B (Calculus II) at 84%. Withdraw rates for these courses were below 9%.
Figure 18: Success Rates for Courses With Highest Enrollment
Source: De Anza College Office of Institutional Research, Planning and Accreditation