
Contents
College Facts and Figures
This webpage includes the following information about De Anza College:
- Full-Time Equivalent Students (FTES)
- Student Characteristics
- Term-to-Term Persistence Rates
- Course Success Rates
- Degree and Certificate Awards
- Employee Characteristics
Full-Time Equivalent Students (FTES)
Colleges are typically funded by a standard measure known as Full-Time Equivalent Students (FTES), which uses a formula to count the course hours taken by all students (full- and part-time) and calculate the equivalent in full-time attendance.
State funding is also available for noncredit courses, with the funding rate depending on the type of course. De Anza has been increasing noncredit enrollment over the past three years and plans continued growth in this area, as shown by the increase from 27 FTES in 2020-21 to 335 in 2024-25.
Figure 1: Enrollment by FTES
Note: FTES represents full-time equivalent total of students taking 12 units. Source: De Anza College Office of Institutional Research, Planning and Accreditation
Figure 2: FTES by Enrollment Category
Note: FTES represents full-time (12 units) equivalent of total student enrollment. “Career Technical Education” represents CTE-designated courses. “Adult Education” includes partnerships with local adult schools. Source: De Anza College Office of Institutional Research, Planning and Accreditation
Figure 3: Dual Enrollment FTES
Note: “Dual Enrollment (non-CCAP)” includes high school students concurrently enrolled at De Anza. “Dual Enrollment (CCAP)” includes high school students taking De Anza courses at their high school. “Middle College” students are 11th- and 12th-graders taking FUHSD classes on the De Anza campus. Source: De Anza College Office of Institutional Research, Planning and Accreditation
Since the COVID-19 pandemic, De Anza has been regaining FTES in Career Technical Education programs and in nonresident students, which includes international students. More than 25% of current FTES consists of students over age 25.
It is important to note that the Foothill-De Anza Community College District became “basic aid” or “community supported” in 2024-25, and as a result will begin receiving a larger portion of funding from local property taxes rather than state apportionment. The Strategic Plan 2027-2030 takes into account our basic aid status. De Anza will continue to monitor FTES and instructional load (or productivity) to ensure that it maintains and enhances fiscal management practices and continued good stewardship of public funds in alignment with the Strategic Plan, Strategic Enrollment Management Plan, the Student Centered Funding Formula and all subsequent (and related) planning documents.
Student Characteristics
De Anza’s student body encompasses a wide range of demographic characteristics: One in three students identify as low-income and are in the first generation of their family to attend college. One out of three enroll full time, taking 12 or more units per quarter.
About 13% of students receive a need-based Pell grant. About 6% of students come from other countries on an educational visa to study in the United States.
Figure 4: Student Characteristics, 2024-25
Note: “Low-Income” is family income below $50,000. “First-Generation” means at least one parent did not attend college. “Enrolled Full Time” includes students taking 12 or more units. “International” includes students with an F1 or FZ visa. “Pell Recipients” are receiving a federal Pell Grant. “Evening Class” represents students who take at last one class after 4:30 p.m. “Students of Color” includes all racial/ethnic groups excluding white and unknown. Source: De Anza College Office of Institutional Research, Planning and Accreditation
Term to Term Persistence Rates
For first-time students with a goal of degree or transfer, the persistence rate from fall 2023 to winter 2024 is 82% overall, dropping to 77% of the original cohort from winter 2024 to spring 2024, and to 69% of the original cohort from spring 2024 to fall 2024.
The rates follow a similar trend for Black, Latinx, low-income and first-generation students, but persistence rates for each group are lower in comparison to the overall rates for all students.
Figure 5: Term-to-Term Persistence, Fall 2023 to Fall 2024
Note: Includes first-time students with a goal of degree or transfer, tracked from fall 2023 to fall 2024. Source: De Anza College Office of Institutional Research, Planning and Accreditation
Course Success Rates
De Anza’s overall course success rate was 80% in 2024-25, with a 12% non-success rate and 8% withdraw rate. The success rate for courses taught face-to-face was 84%, followed by the rate for hybrid classes at 81% and the rate for online classes at 79%. This represents a difference of 5 percentage points between face-to-face and online course sections.
Figure 6: Course Success by Instructional Modality, 2024-25
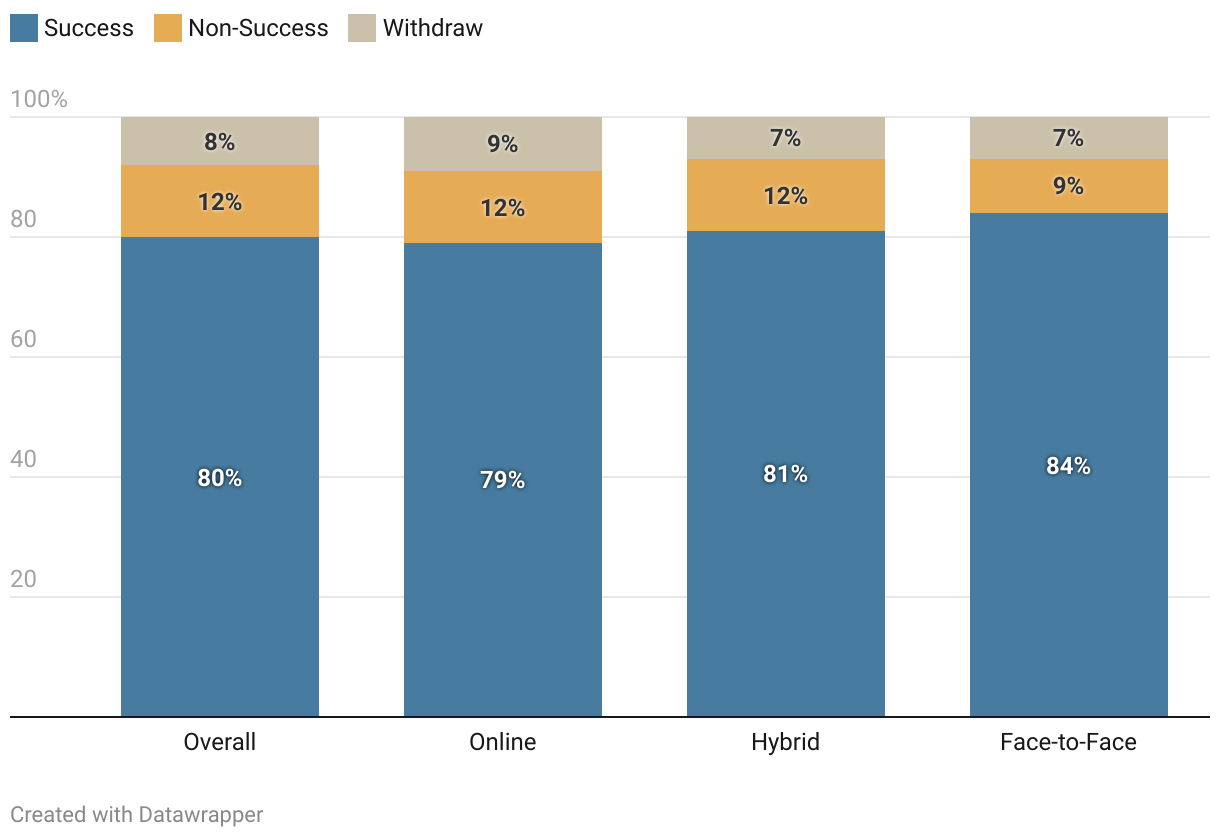
Note: Success includes grades C or higher. Non-success includes D, F and I, Withdraw includes W and EW. Source: De Anza College Office of Institutional Research, Planning and Accreditation
Course Success by Race/Ethnicity
Course success rates are highest for students who identify as Asian (87%). Rates are lowest for students who identify as white (70%), followed by students who identify as Black (72%). Withdrawal rates are also highest for white, Black and Latinx students.
Figure 7: Course Success by Race/Ethnicity, 2024-25
Not graphed: students of unknown ethnicity. Source: De Anza College Office of Institutional Research, Planning and Accreditation
Course Success by Gender
Female students have a slightly higher course success rate of 82%, compared with 79% for male students. Male students have the highest withdraw rates, at 13%.
Figure 8: Course Success by Gender, 2024-25
Source: De Anza College Office of Institutional Research, Planning and Accreditation
Degree and Certificate Awards
While the number of associate in arts (A.A.) degrees awarded by De Anza has decreased over the last five years, the number of associate in science (A.S.) degrees has remained constant and the numbers of associate degrees for transfer have increased. There has been rapid growth in noncredit certificates, which were first awarded in 2021-22.
Figure 9: Total Degree and Certificate Awards by Year
Source: De Anza College Office of Institutional Research, Planning and Accreditation
Figure 10: Associate in Arts Degrees Awarded by Year
Source: De Anza College Office of Institutional Research, Planning and Accreditation
Figure 11: Associate in Science Degrees Awarded by Year
Source: De Anza College Office of Institutional Research, Planning and Accreditation
Figure 12: Associate in Arts for Transfer Degrees Awarded by Year
Source: De Anza College Office of Institutional Research, Planning and Accreditation
Figure 13: Associate in Science for Transfer Degrees Awarded by Year
Source: De Anza College Office of Institutional Research, Planning and Accreditation
Figure 14: Credit Certificates Awarded by Year
Source: De Anza College Office of Institutional Research, Planning and Accreditation
Figure 15: Noncredit Certificates Awarded by Year
Source: De Anza College Office of Institutional Research, Planning and Accreditation
Employee Characteristics
De Anza employed 21 administrators, 234 full-time faculty members, 424 part-time faculty members and 264 classified professionals in fall 2024. Nearly 60% of all employees were female.
Figure 16: Employees by Category and Gender, Fall 2024
Source: California Community Colleges Chancellor’s Office
Employees and Students by Race/Ethnicity
When comparing the race or ethnicity of employees to students, the groups with the largest disparities are Asian (43% of students and 26% of faculty) and white (20% of students and 51% of faculty).
Figure 17: Employees and Students by Race/Ethnicity, Fall 2024
Sources: California Community Colleges Chancellor’s Office, De Anza College Office of Institutional Research, Planning and Accreditation